Ganntt Charts
You can make a time plan that is just a list of tasks, but it
a bit rubbish as a project management tool. Better and used by most Project
managers is a Gantt Chart. This is a bar chart that shows the order things
need to be done in, how long they will take and whether or not you have done
them.
here's an example of one for making a website. The picture below explains what some of it does
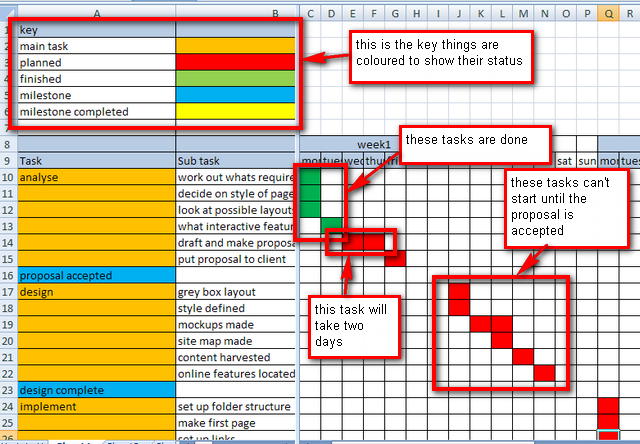 The
Gannt chart will always have dates or days or even hours on it. Tasks can
happen one after the other this is called serial.
The
Gannt chart will always have dates or days or even hours on it. Tasks can
happen one after the other this is called serial.
Or tasks can happen at the same time if you have more than one person working on a project. This is called parrallel
The colours show all sorts of things about a task; whether it is planned or whether it is finished. Gantt charts also usually have things called milestones on them. These are important parts of the project. For example when the client agrees to your proposal or when you finish your implementation. These are the points in the project that when thay are completed you can allow yourself a pat on the back and a stiff drink. The final milestone should be project finished this is the point at which hopefully you have other people patting you on the back and they are buying the drinks.